Iran’s economy has faced a series of existential crises since the 1979 revolution. Tehran suffered the biggest shocks from the sapping costs of an eight-year war with Iraq, between 1980 and 1988, and the final wave of international sanctions imposed in 2010. During less volatile years, Iran’s productivity did increase. But Iranians were burdened by chronic unemployment and inflation. Greed and gross mismanagement further undermined growth. When he took office in 2013, President Hassan Rouhani acknowledged, “The previous government was the wealthiest and most indebted government.”
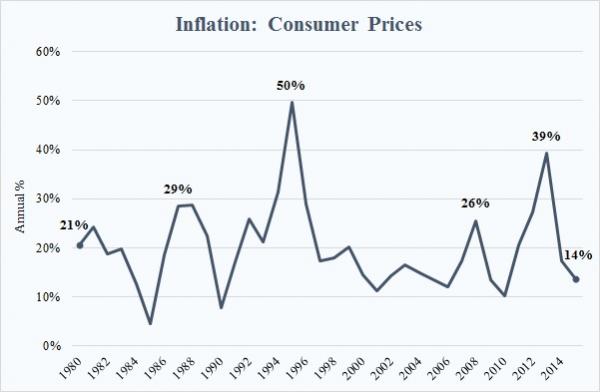
- Inflation: Ranged from 21 percent in 1980 to 14 percent in 2015, and has plummeted to 8 percent in May 2016 according to the IMF. Four big bumps occurred in 1987/88, 1995, 2008 and 2013 from the aftermath of the Iran-Iraq War and various sanctions from the United States and European Union.
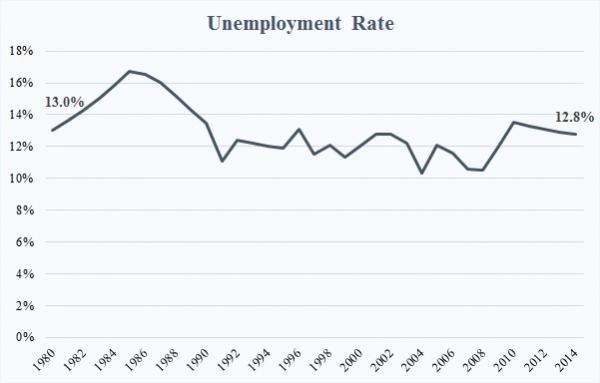
- Unemployment: Especially high during the Iran-Iraq War, but also after it ended. The official rate has been under 21 percent since 1979, although experts say it has at times been twice as high.
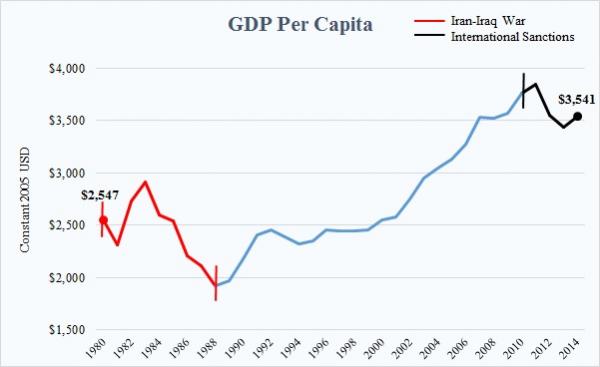
- GDP per capita: Increased sporadically, although income inequality was significant. In 2013, the top 20 percent of Iranians earned almost 45 percent of total income.
- Consumer Price Index: Steadily rising cost of goods and services for the average consumer.
- Military Expenditures: Expenditure peaked at 8 percent of GDP in 1982, during wartime, and declined quickly to about 2-3 percent after the war.
- Currency rates: Rial’s value declined steadily against the U.S. dollar, particularly after 2002 when Iran’s nuclear program became publicly known.
- Trade with the United States: Exports from the United States to Iran went from a high of $13.4 billion in 1978 to $280 million in 2015. Imports from Iran to the United States went from $10.5 billion in 1978 to $10 million in 2015.
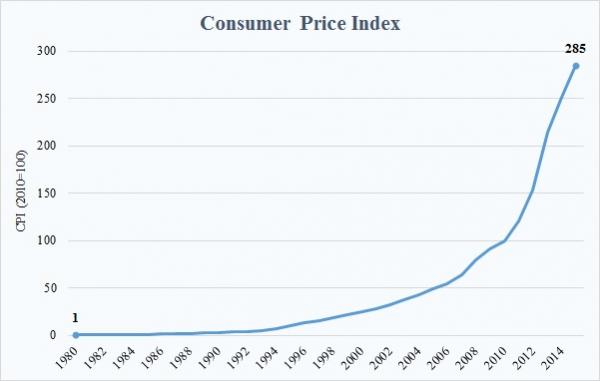
*The World Bank defines the Consumer Price Index as reflecting “changes in the cost to the average consumer of acquiring a basket of goods and services.” In other words, the CPI shows the relative change in prices compared to a base year, even when taking into account inflation.
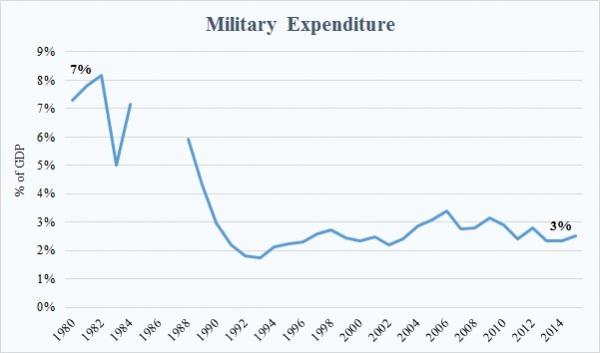
(1988-2015): World Bank; World Bank source: Stockholm International Peace Research Institute (SIPRI)
*Data unavailable for 1985-87.
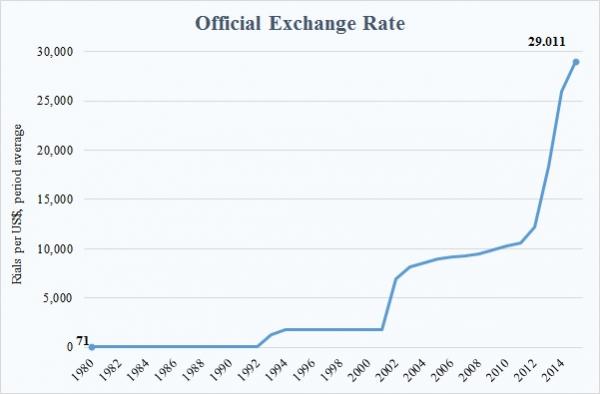
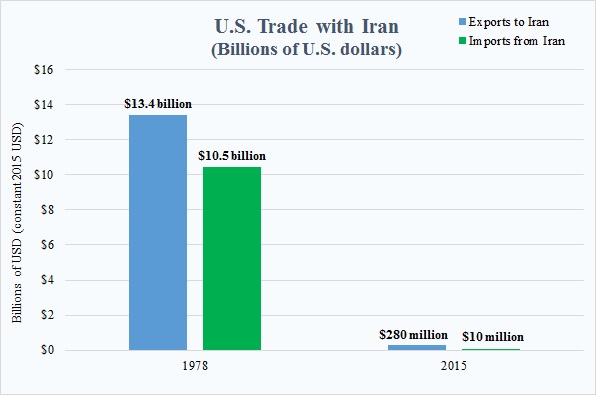
*Values converted to real 2015 dollars using the average annual Consumer Price index
** Through subsidiaries, American energy companies continued to buy Iranian oil—worth up to $3.5 billion a year—off the international market in Rotterdam until the mid-1990s, when sanctions were broadened.
Katayoun Kishi is a research assistant at the U.S. Institute of Peace.
